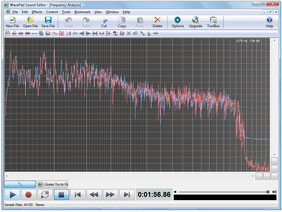
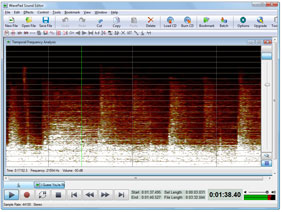
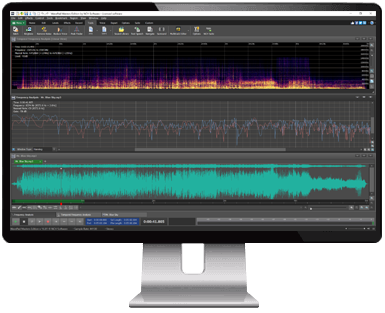
FFT GraphThe FFT graph works by taking a small sample of audio and plotting a graph of frequency (x-axis, in Hz) versus intensity (y-axis, in dB). The graph features two different plots if the audio is stereo, otherwise just the one plot will be displayed. The frequency of the graph ranges from 0Hz to half the sample rate of the audio, whilst the intensity range goes from -128dB to 0dB.TFFT GraphThe TFFT graph works by plotting the intensity of the frequency spectrum of the audio across time, and represents intensity through color. The x-axis is used for time (in hh:mm:ss format) and spans the duration of the audio selection. The y-axis is used for frequency (in Hz) and depicts the spectrum of the audio at any one point in time (like the FFT it goes up to half the sample rate of the audio). Then at every point in time and frequency, an intensity calculation is done and a dB figure is calculated (between -128dB and 0dB). This figure is mapped to a color intensity scale and then drawn on the graph, with pure black representing -128dB and pure white representing 0dB.
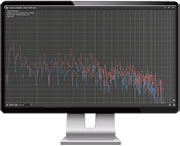
Live FFT AnalysisThe live FFT Analysis display takes the real-time audio from your selected recording device and automatically graphs the frequency versus intensity.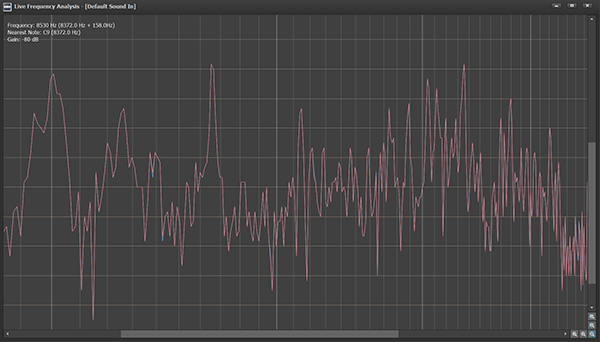 | Audio AnalyzerAnalysis Features Editing Features About FFT Graphs About TFFT Graphs Download Now - for Windows - for Mac - for iPhone - for iPad - for Android - for Kindle Questions (FAQs) Technical Support Discussion Forum Pricing & Purchase Related Audio SoftwareDeskFX Oscilloscope MixPad Audio Mixer Express Rip CD Ripper Express Burn CD Burner Switch Sound File Converter Stamp ID3 Tag Editor Audio Frequency Generator BroadWave Audio Streamer Voice Recording Software More Audio Software... | ||||||||||
| |
We serve cookies to analyze traffic, customize content and improve your experience.
We share information with analytics, social and advertising partners according to our privacy policy.